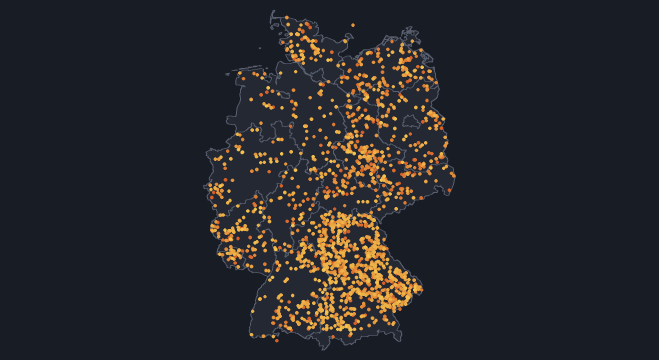
The Build-Out
Play the timeline and each park lights up in the year its embedding dates the build. Under the map, each column is a register year, split by how far the embedding's date falls from it: predicted (the same year), ±1 year, or more than a year off. Click a park to see how sharply its embedding splits at each candidate year beside its control site, and swipe between Sentinel-2 views from before and after. The map opens on a Brandenburg park that the embedding dates to its register year.
One Split per Park
The idea is that a park's embedding sits in one place while the ground is farmland or scrub, and somewhere else once it is covered in panels. The method tries every split of the years into a before and an after, keeps the one where the two halves' mean embeddings differ most, and calls the first year after it the build. The split itself sees no dates or labels.
Where It Misses
A miss is a date 2 years or more from the register's. Many MaStR locations hold units commissioned in different years, while the map dates each location once. These phased sites miss 32.1% of the time, against 14.3% for sites built in a single year, and their misses are mostly late, as expected when the split lands on a later phase. Clicking a park lists every unit year at its location. The early misses at single-year sites are unexplained.
The ends of the record are harder, because a split needs years on both sides. The embedding dates 424 parks to 2024 where the register commissioned 584, and a build late in 2024 may show mostly in 2025. That is plausible and untested.
Spotting solar farms from orbit is already established (Kruitwagen et al. 2021), so this page only dates them.
How this was made
MaStR is the Bundesnetzagentur's Marktstammdatenregister. The sample is every ground-mounted solar site in it (extract 20260921) with at least 1 MW of net capacity whose first unit was commissioned between 2018 and 2024: 2,029 parks outside Berlin. Each is read as a 50 m window around its registered point in every annual embedding. On the raw embeddings the split already dates 80.0% of the held-out parks within a year of the register. Mapping each year onto 2025 first, by an orthogonal Procrustes fit estimated on control sites only, gives the 81.0% above, a difference too small to separate from noise on the parks.
This result is exploratory. The split was chosen among estimators and frame corrections on a validation split and scored on a test split, and a simpler estimator, the largest single step between consecutive years, dates 56.9% of the test parks within a year. Both splits are random by 3 km site cluster, so a park, its control and every nearby site land on the same side. No region is held out, so how well the dating transfers to a region it never saw is not measured. Within a year means either side. A bootstrap over the 244 test clusters puts the split at 77.0% to 85.0% and the constant guess of 2023 at 59.7% to 70.1%. Each park on the map is dated by a model that never saw its cluster. Across all 2,029 parks, 82.5% fall within a year, a figure that includes the validation parks used to choose the method.
Phased sites miss 32.1% of the time (371 parks) against 14.3% (1,658), an odds ratio of 2.13 (95% interval 1.49 to 3.07) after controlling for year, size and unit count, with 79 late and 40 early. Over all 356 misses the balance tips early (234 early, 122 late). Parks the register dates to 2018 are dated within a year 48.1% of the time (27 test parks), with only 2017 before them, and the embedding dates 79 parks to 2025 (a year outside the register sample). A logistic classifier on the same embeddings tells a park from its control with a test AUC of 0.947.
Every number here is agreement with MaStR, a register with its own errors, and validates neither the register nor the embedding. A park's point is the mean of its units' registered coordinates, so at a sprawling site it can fall off the array. Parks above 20 MW are dated within a year 68.0% of the time (25 test parks), and whether window placement causes that is untested. The controls were cleared against registered coordinates, not footprints. Estimated footprints put 3 of 2,029 controls on a registered park, none in the training split. The park chart reads all 64 dimensions, and its peak is the dated year by construction. The images are the clearest Sentinel-2 summer scenes over each park in the years either side of its dated year (50 parks have no clear pair), and a scene date is not a construction date.