The gold cells on the map lost the most length. They sit where a 6 km square contains several kinds of ground at once, whereas the deep blue cells are uniform and keep most of theirs.
Why an Average Gets Shorter
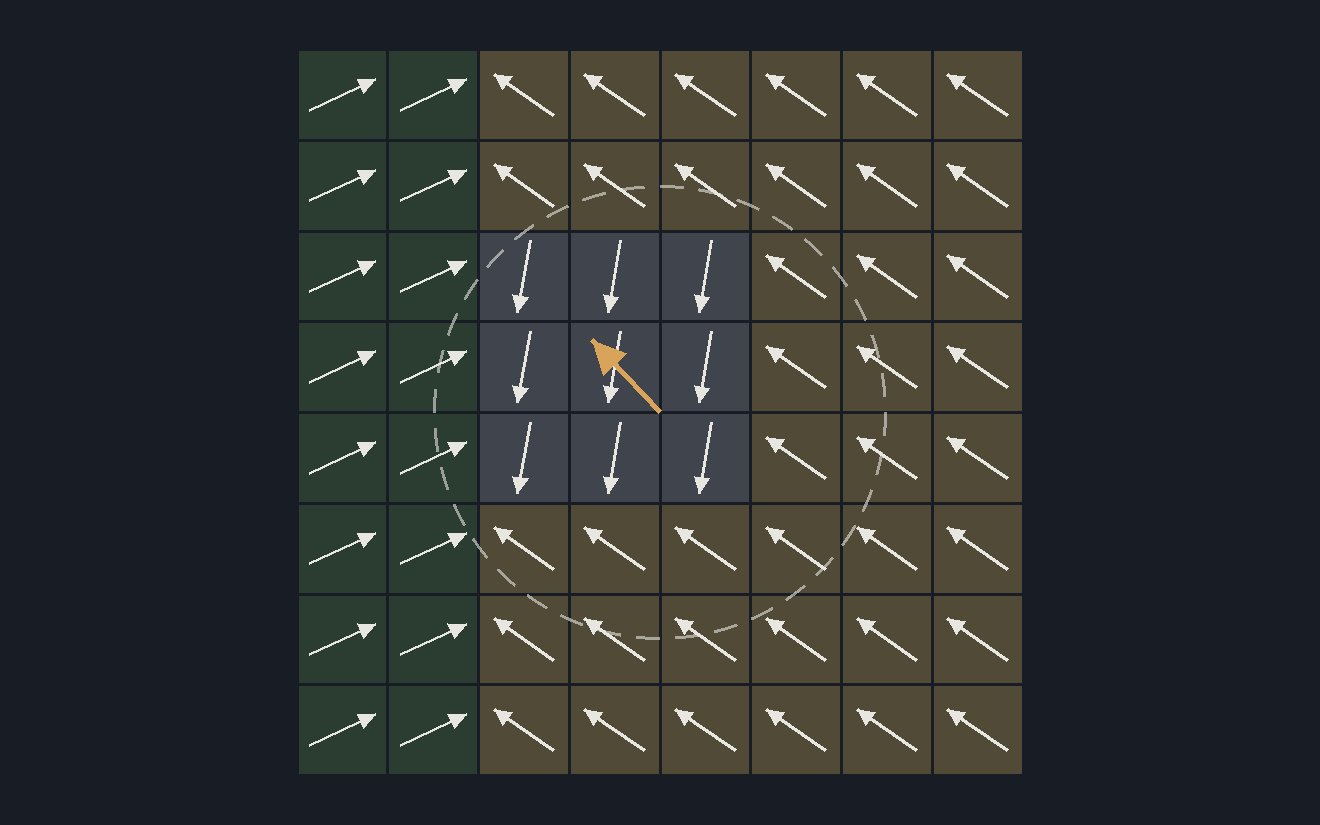
Draw on the patch below. Each square stands for one pixel, and its arrow points in its land cover's direction at full length. The gold arrow is their average. Paint the patch a single cover and the average reaches the dashed ring. Mix the covers and the arrows partly cancel, so the average falls short of it. The directions are invented, in two dimensions rather than 64.
What a Shorter Vector Costs
If the direction holds, very little. The direction is what encodes the land cover, so a shorter average that points the same way still says what kind of ground the cell is. Every cell on this site is rescaled to length one before it is compared or fitted, which discards the length and with it the record of how mixed the cell is. What averaging can cost is the direction itself, which in a mixed cell is pulled toward the mean of its covers.
Shorter Inside One Cell
The shortening starts far below 6 km. In one Paris window, averaging over blocks of 640 m already leaves the median block with 0.92 of its native length, and the lengths spread wider at every step up in block size.
How this was made
Lengths are ratios to one shared reference, the median length of the 10 m pixels in one Paris window, so no absolute radius is quoted. Single pixels vary in length by a coefficient of variation of 0.20%. Averaging the window over blocks of 40, 160 and 640 m raises it to 0.86%, 2.56% and 3.78%, and across Europe's 6 km land cells it is 5.95%. The 6 km figures and the map cover land cells only. The Paris ladder is one city, and the Europe ridge is a different region drawn for comparison, not a continuation of the same curve. On the map the coast is Natural Earth's 10 m coastline drawn over the cells.
Averaging inside a 6 km cell contracts a mixed neighbourhood toward its own mean direction. Whether this explains the loss in the site's headline comparison is a hypothesis, because no arm in the comparison aggregates the embedding any other way and the comparison cannot isolate it. The narrower claim is that mean-pooling a hypersphere embedding to 6 km appears to be the wrong operation.