Averaging Codes Is Not Averaging Values
AlphaEarth stores each of its 64 numbers as an 8-bit code on a square-root scale, so the value a code stands for grows faster than the code. Drag the two codes along the curve. The average of their values lies on the straight line between them, while the value of their averaged code lies on the curve, away from that line. Pooling 40 m pixels into 6 km cells by averaging codes made this error in every number at once, and pointed every cell slightly the wrong way.
The Fix
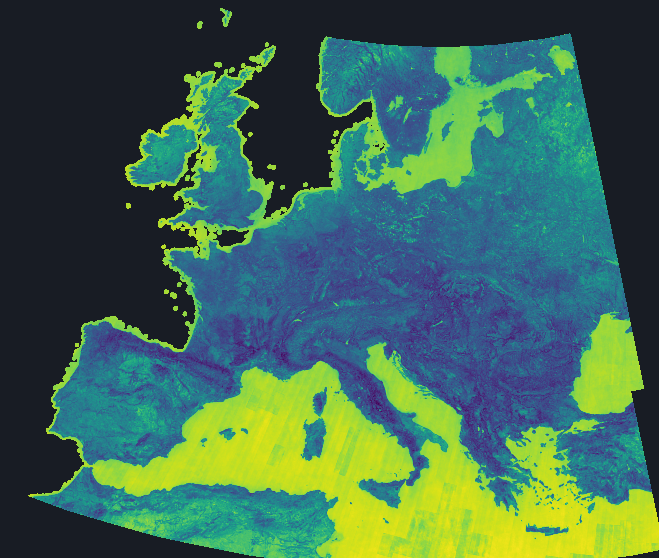
The fix decodes every pixel first, averages the values with each tile's pixel counts, and rescales each cell to length one. The map above shows how far each cell turned when it went in, in whole regions rather than scattered cells. The comparison with the hand-crafted covariates barely moved, and most cells kept the same nearest neighbour.
How this was made
A probe on real tiles first measured the error at a median of 9.61° over 710 cells. Across Europe in 2018 the median cell turned 10.79°, and 33.2% of cells turned by more than 14°. The nearest neighbour of a cell, which the continent map and the unusual-places tour both read, stayed the same for 72.4% of 239,827 cells (2024, block 512). The embeddings' RMSE was 4.17% worse than the covariates' before the fix and 4.19% worse after.
The compared window is not exactly the shipped grid. Nearest-neighbour agreement is a count over near-ties, so it is quoted with the block size it was computed at. The largest turns cluster by region, so a small sample of tiles can land far from the median.