Stand by Stand
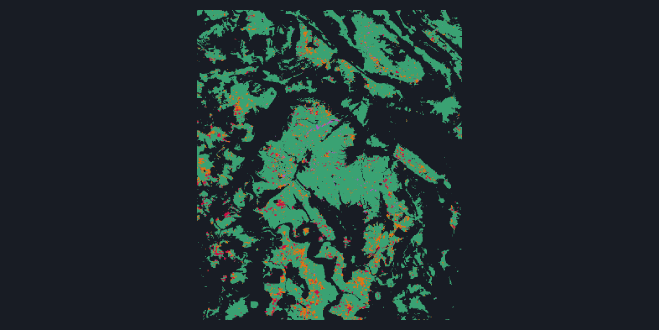
The map shows one forest at a hectare per stand, coloured by when FCCL records the stand's canopy lost. The plot beside it follows a stand through the embedding, one point a year from 2017 to 2025. Point at a stand to trace its path and click to keep it. Each forest opens on a pair of stands that sat close together in 2018: one still standing, whose path is drawn in green, and one that FCCL records as lost in 2019 to 2021.
Forest by Forest
The score is average precision, which rewards a ranking for putting the lost stands first. A random ranking scores the base rate, the share of stands lost, and a perfect one scores 1. That share differs from forest to forest, so each forest has its own panel and its own scale, with its base rate marked. The embedding is ahead in every one, the Black Forest included, which was chosen as the control because FCCL records the least loss there. In the Solling, split by the disturbance agent that EFDA v3.0.0 assigns to the 2019 to 2021 loss, the embedding stays ahead on the loss it puts down to wind and bark beetle, so harvest alone does not explain the lead.
After 2021
In the Solling the same 2018 ranking also finds the survivors that FCCL records lost from 2022 on, at a median average precision of 0.081 against 0.032 for the covariates and a base rate of 0.014. It is a better ranking, not a forecast anyone would act on.
How this was made
FCCL maps forest canopy loss across Germany at 10 m, month by month, against a fixed 2018 forest mask. Every forest pixel in the 4 forests is labelled by whether FCCL records it lost in 2019 to 2021. Pixels already lost in 2018 are a feature of every model, not a label, so no model gets credit for a stand that was already gone. Gradient-boosted classifiers rank the pixels, one on the 64 dimensions of the 2018 embedding, one on the covariates (terrain, land cover, built-up and population fields) and one on both.
Whole spatial blocks, at least as large as the loss field's own correlation length, are held out together. Each score is the median over held-out blocks of the average precision within a block, never pooled, and at 10 m the embedding ranks FCCL's loss better in every held-out block of every forest. In the Black Forest, the control, a lead shows only that the ranking is not specific to the hardest-hit forests. It says nothing about why they were hit.
The embedding has 10 m pixels and the covariates 100 m cells. Averaged to 100 m before fitting, and even cut to its first 12 principal components, the embedding still wins on FCCL's loss in every held-out block in 3 of 4 forests. In the Black Forest the averaged embedding reaches 0.048 against 0.045 for the covariates, at a base rate of 0.013, and does not win in every block, so there the finer resolution alone could account for the lead.
In the Solling, over every test stand including those already lost by 2021 (which FCCL cannot record lost a second time), the forward figures are 0.038 against 0.022 at a base rate of 0.012, and neither forward figure is comparable with the 2019 to 2021 scores, because the stands and the base rate differ. On the 2019 to 2021 loss that EFDA attributes to wind and bark beetle the embedding scores 0.521 against 0.365 for the covariates, at base rates of 0.029 to 0.040.
A stand on the map is a hectare, the mean of 10 by 10 embedding pixels. Each year's embedding is mapped onto 2018's by a fitted orthogonal map, estimated only on stands with no loss FCCL records between 2018 and mid-2025. The plot projects every year onto the two directions that vary most across all forest stands, lost or not, which account for 51.6% to 59.1% of the variance, depending on the forest.
Every number here is skill against FCCL_DE_P1M, a satellite product with its own errors, taken from its publication rather than re-measured. Its forest mask is fixed at 2018 and later loss is counted against forest that may already have changed. A stand already browning in 2018 can be ranked by the browning itself rather than by anything that caused it. Salvage felling follows beetle kill, so mortality and harvest stay entangled, and EFDA merges wind and bark beetle into one class. The 100 m average is not laid on the covariates' own grid, and a richer set of covariates might close the gap. The blocks are not buffered: in the Solling 97.02% of forest pixels lie within one correlation length of a pixel in another block. Blocks of 10 km cut that to 14.86% without shrinking the margin, but leakage beyond that scale was not tested, block size moves with block count, and no comparison between separate runs has an uncertainty estimate. The forward and agent figures cover the Solling alone, from a single fit. The alignment's removed component is not identified, and the map colours a stand by the first window in which at least 30.0% of its forest is lost, which is a display choice.