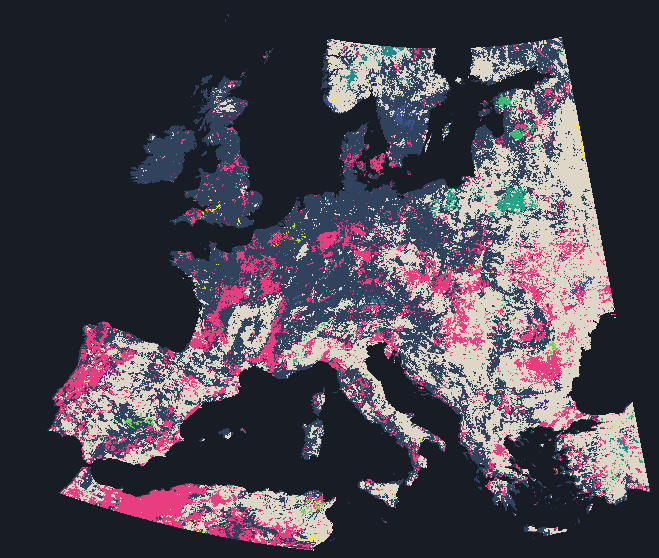
AlphaEarth describes every place on land again each year. A place that did not change should keep the same description, yet every place moves a little every year: crops rotate, forests are felled, and the imagery itself varies with cloud and snow. What differs from place to place is how it moves.
The Ground toggle puts a circle of Esri World Imagery under the pointer, or where you tap. That imagery is a single mosaic whose acquisition dates vary from place to place and are not given here, so it shows what is on the ground, not when it changed.
Kinds of Change
A place is trending when the order of its years matters, when it keeps moving the same way rather than wandering, and 15.4% of land is. A place is marked by an anomalous year when one year lies far further from its average than any other. The rest are variable or steady, split at the median. Each kind in the legend lights up on its own when chosen.
Steadiness
Steadiness is how far a place's years stray from its own average, and the median land cell strays 7.3°. The changes do not add up. The median cell ended 10.7° from where it started after a path of 83.3°, far shorter than independent yearly steps would leave it, so consecutive changes tend to reverse.
Year by Year
Year by year plays each year's distance from a place's own average on one fixed scale, so the same brightness means the same angle in every year and every place. Beside it, a matrix compares every pair of years, and pointing at the map traces one place's path through them.
Changed in One Year
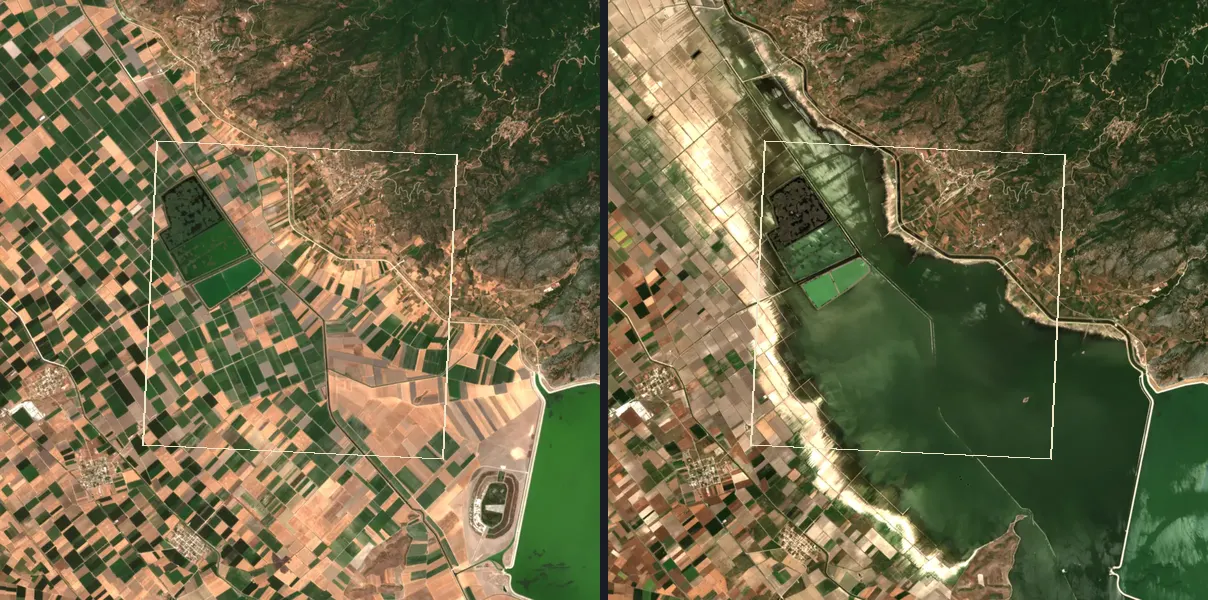
Some places change once rather than steadily. In each of these 10 places, one yearly step is far larger than the place's usual step, and the readout gives both as angles. Every place comes with a pair of Sentinel-2 scenes, one from before the change and one from after, the map cell outlined on both.
A fire splits a place's years into those before it and those after, so their order matters and the place can end up trending. Where a place here burnt and is marked trending on the map above, that is the likely link. The two scenes are single days, sometimes in different seasons, while the embedding describes each whole year, so not every difference between the pictures is part of the change on the map.
How this was made
AlphaEarth publishes one embedding per year, and the years do not line up with one another. A direct cell-by-cell comparison of two years would mostly measure that continent-wide mismatch rather than change at the place. Every year is therefore mapped onto 2018 first, by an orthogonal map centred on the continent's mean embedding and fitted on 150,560 land cells. Centring changes the median aligned angle by at most 0.11°.
The kinds are assigned by a fixed priority. Trending comes first. Of what is left, a cell is marked by an anomalous year when its most distant year sits at least 1.5 times as far from that cell's mean as its next most distant year does. The remainder splits at the land median spread, 7.3°: variable at or above it and steady below. Of 150,560 land cells, 23,197 are trending, 4,426 are marked by an anomalous year, 59,303 are variable and 63,634 are steady. Most land cells spread between 5.5° and 10.9°, and spread ranks places almost exactly as the average yearly step does (rank correlation 0.95), so one map serves for both. Taking each cell's end-to-end distance over its path length, the median land cell gives 0.13, where independent yearly directions would give 0.36.
The median land cell changes by 10.4° a year, and most land cells fall between 7.8° and 15.2°. How much a cell changes belongs to the place. Ranking land cells by average change once for 2017 to 2020 and once for 2021 to 2025 gives a rank correlation of 0.61 across 150,560 cells. Shuffling the later ranking between cells gives -0.001. The two periods share no year, so no single anomalous year is counted in both.
Trending asks whether the order of a cell's years matters. A straight line is fitted through the years, then compared with the same years in 199 shuffled orders. A cell passes only where at most 5.0% of those orders fit as well, and 15.4% of land passes. The shuffles are random, so a rerun with more of them moves a few per cent of cells across the line, and every trending count here has that uncertainty. Pointing at the map gives the size of a passing cell's trend. The test also fires where neighbouring years merely resemble each other, so it locates where the order matters and says nothing about what produced it.
Pointing at the map also names a cell's biggest change, its largest single step, but only where that step is at least 1.5 times the cell's own average step. That holds for 14.8% of land.
Each cell is drawn as a square in its own colour, and the coast is Natural Earth's 10 m coastline drawn over the cells. The pointer reads the one cell under it.
The alignment is a fitted map, and what it removes is not identified. Each year's mean embedding differs from 2018's by 9.1° to 15.0°, and a real continent-wide change of that kind could be removed along with the frame. The map is fitted on the same cells it is applied to. An earlier test fitted a simpler, uncentred map between consecutive years on held-out blocks, and it still removed 1.70° to 4.96° of apparent change per year. That test predates a repair of the yearly files and has not been rerun for this map. Steadiness here is steadiness of AlphaEarth's description of a place, and a trend here is a straight line fitted through that record rather than a named process. Independent noise in each annual layer would also produce this year-to-year pattern, so a cell can look unsteady because its imagery varies with cloud or snow as well as because its surface changes, and the map cannot separate the two. None of the least steady places has been checked against imagery yet.