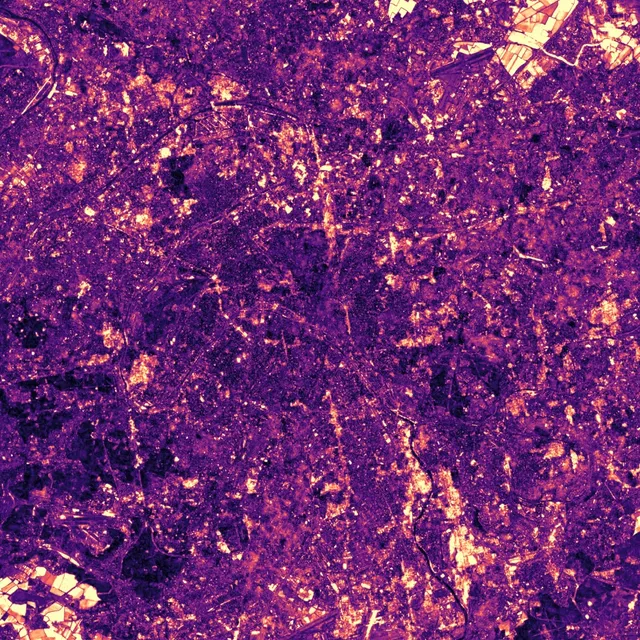
A city changes every year. Blocks go up, rail yards empty out, the fields around the edge are ploughed and sown again. One satellite picture shows all of it at once and cannot tell an ordinary change from an unusual one. The embedding describes every 10 m patch of ground again each year, so each year of a place can be measured against that same place's other years. This card does it for 6 cities, each a 30 km square.
A Year Against Its Usual Self
The map shades each place by how far that year's texture lies from its own average over all 9 years. Bright means the place looked unlike itself that year, which is not the same as having changed since the year before. Scrub through the years and most of the city stays dark while a few patches brighten for a year or two.
The bars under the timeline give each year's share of the city, counting the places for which that year lies furthest from their average. An even split would give each year 11.1%. In Paris, 2024 takes 55.1%. A place that keeps changing one way can only push its furthest year to the first or last of the record, so a peak in the middle needs something unusual in that year, and the end years are muted.
The bright ring around most cities is probably farmland rather than building work, since a ploughed field looks different from one summer to the next. Near Paris, a patch of cropland turns 51° from year to year, more than the Olympic village did while it was being built (15°). The Paris map marks both.
Before and After
Switch the view to Satellite to see the ground under the map. Left of the handle is 2017, right of it the year on the scrubber, both from Sentinel-2 and cut to the same square, so a bright patch can be checked against what was built or cleared there. In Paris, scrub to 2024 and drag the handle across the Olympic village.
How this was made
Each city is a 30 km square of AlphaEarth Foundations' annual embedding at 10 m, 2017 to 2025. A pixel's distance in a given year is the angle between that year's embedding and the pixel's mean over all 9 years. Zooming in swaps the overview for the native 10 m image, and pointing at the city reads a 100 m block.
Nothing is claimed about the first or last year of the record. A place that changes one way at an uneven rate can put its furthest year at either end of the record on its own, so a peak there says nothing about that year. A year in the middle cannot arise this way, which is why 2024 in Paris and Athens is the finding. The map says which year stands apart, not why.
Nothing on the map separates building work from crop churn. A filter scoring how lasting each shift is suppresses the Paris cropland only 3.7 times more than the construction site, too little to isolate construction, so none is applied.
The satellite views are Sentinel-2 L2A true colour, from Microsoft's Planetary Computer archive. For each city and year, the April to October scenes with the least cloud are scored over the square itself, the clearest of them is used, and any cloud left on it is filled from the next clearest. The date can fall anywhere from April to October, so a pair can differ by season as well as by year. Each view is warped onto the embedding's own grid, so the two line up pixel for pixel. Contains modified Copernicus Sentinel data.
On the site's honesty tiers this is Tier B: a description of what the embedding does over a city, not a measurement of temperature or anything else, and not part of the headline comparison.